Designing with Live Data
Apr 7th, 2020 - Written by Mark Land
The inspiration for this post was an interaction design course our director Andree teaches with his amazing colleague, Olga Voskoboinikova, at his alum university, Umea Institute of Design, in Sweden.
For context: Adding data to your prototypes ain't really new. What we, at blended, basically do here is to combine the capability of plugins in XD or Sketch with the capability of web-based spreadsheets and freely available APIs:
Data from the web -› Google Spreadsheet -› Adobe XD
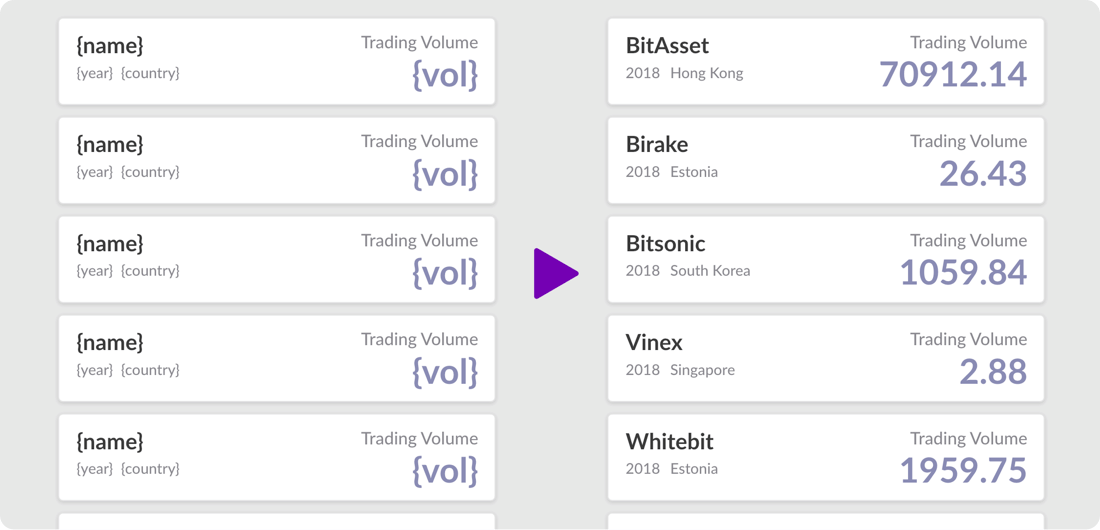
Designers now have the means to quickly populate their prototypes with real (live) data: Data from any website, that is, with reasonable effort.
Eventually, we don't need the spreadsheets in between. Speaking long-term, it’s clear that the builders at Adobe or Bohemian Coding must enhance their tools with data capabilities in order to be able to populate protoypes with real data fast and efficiently.
Adding live data to your prototypes
This post will show you a “data-driven” process that’s easy to follow. Once you have set up the process, the effort of adding real data is really low. The goal for Sketch, XD or Figma should be to design with live data on the fly. This is only "kind of" possible at the moment. Luckily though, the community of designers and developers is getting close to making this happen. At the end, we will briefly discuss what’s missing.
This article will show you the how to do this.
- The process to get real data from your backend, or any other online service (from APIs), into your prototype
- Add the data to a structured spreadsheets and select only the data you need for your layouts
- Pull that exact data into your Adobe XD layouts
What you will achieve
You can pull any data from any online service or website that offers a public API (ie. no authentication required). These could be The Weather Channel. CoinGecko and even Soundcloud.
At the end, you will have a list of items in XD that will contain the data from the spreadsheet. Here’s what’s important: Each data point (or actual cell) within the spreadsheet needs to relate to one single text field/layer in XD. If you create the XD file or element yourself, make sure to have one text field/layer for each data point.
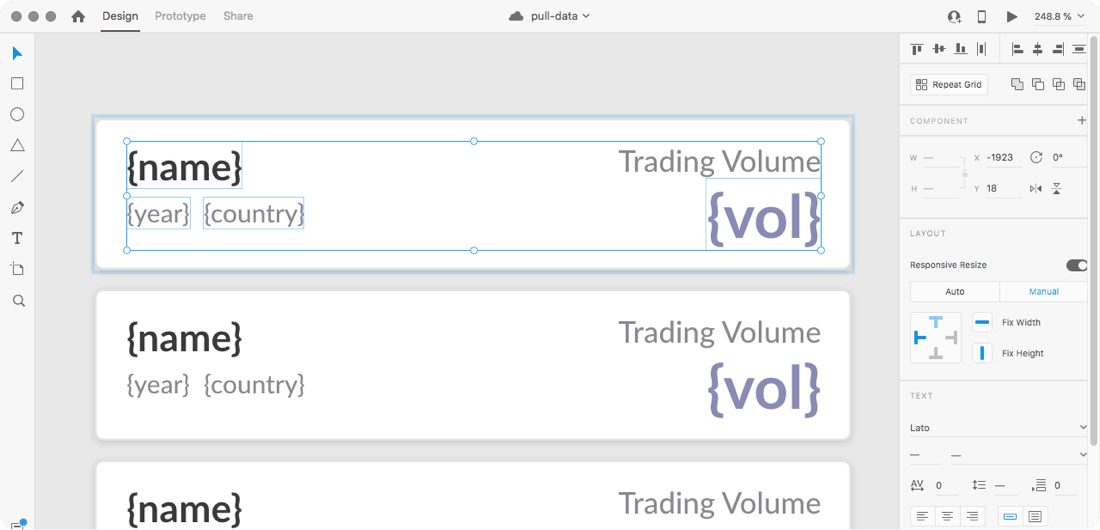
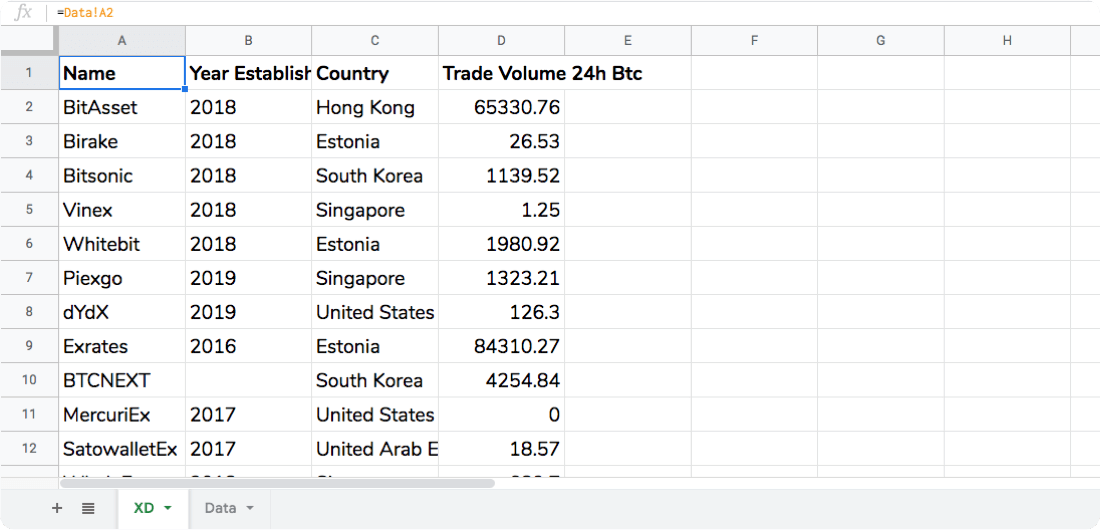
The respective spreadsheet that contains the actual data looks like this:
Let’s get started
Here’s what you need:
- A prototype or at least a list element with repeated text fields and images. Here’s one to get you started
- Adobe XD and the Google Sheets plugin
- A new Google Sheets spreadsheet (through a Google account)
- A public API that provides the data for out prototype, e.g. the one from CoinGecko
In order to be able to follow the process from start to finish, please download the XD file above (here’s the file) and download the Google Sheets plugin within XD. If you already have both the layout and the plugin, skip ahead.
High-level steps:
- Open our file in XD and install the Google Sheets plugin in Adobe XD
- Create a new spreadsheet in Google Sheets in a personal Google account that everyone can access (or a paid-for Google Apps for Business account; FYI: a legacy Google business account will not work as with that type XD cannot access the spreadsheet). Use our spreadsheet for testing purposes.
- Create a new Apps Script file, copy and paste the JS snippet and authorise the script
- Pull the data from the live API into your Google spreadsheet
- Pull that same data from the Google spreadsheet into your XD layout
There are a few more clicks required than the steps above imply, so make sure to read the details below. Whenever it says “spreadsheet” below, meant is the Google spreadsheet that you have created. You may use our spreadsheet for testing purposes.
Step 1
Either use our file or create your own with an element that has 4 separate text fields/layers. Each text layer will match one column in the spreadsheet. Hence, you will need to have 4 separate text layers.

Step 2
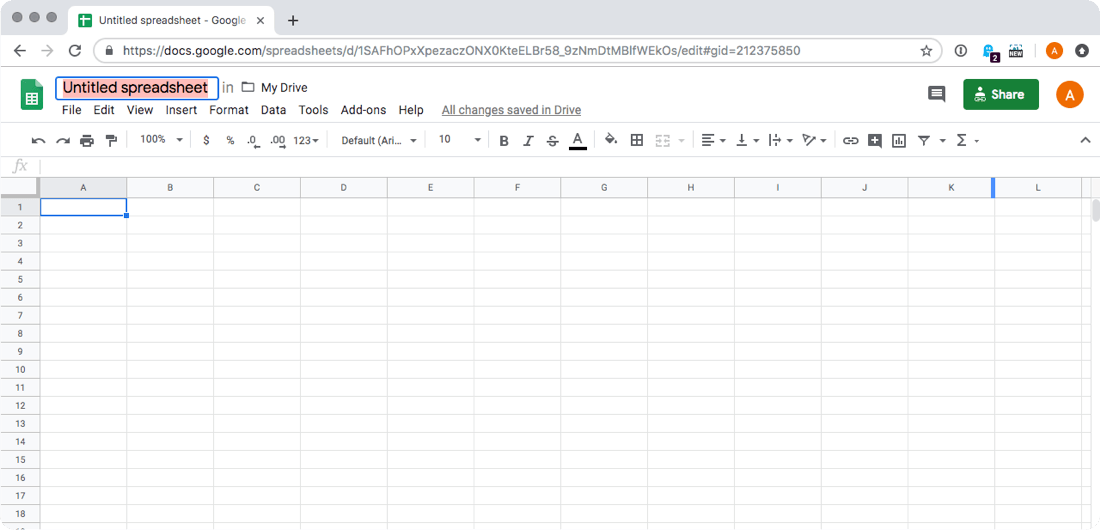
- Create a new spreadsheet or use ours
- Name the spreadsheet, e.g. “Fetch Data” (if you don’t do it here, you will have to do in minute)
- At the bottom, create a new tab via +. Name the first tab “XD” and the second “Data” (the names don't matter technically though)
Step 3
This step is a little tricky if you have not used the App Script editor before, so stay close.
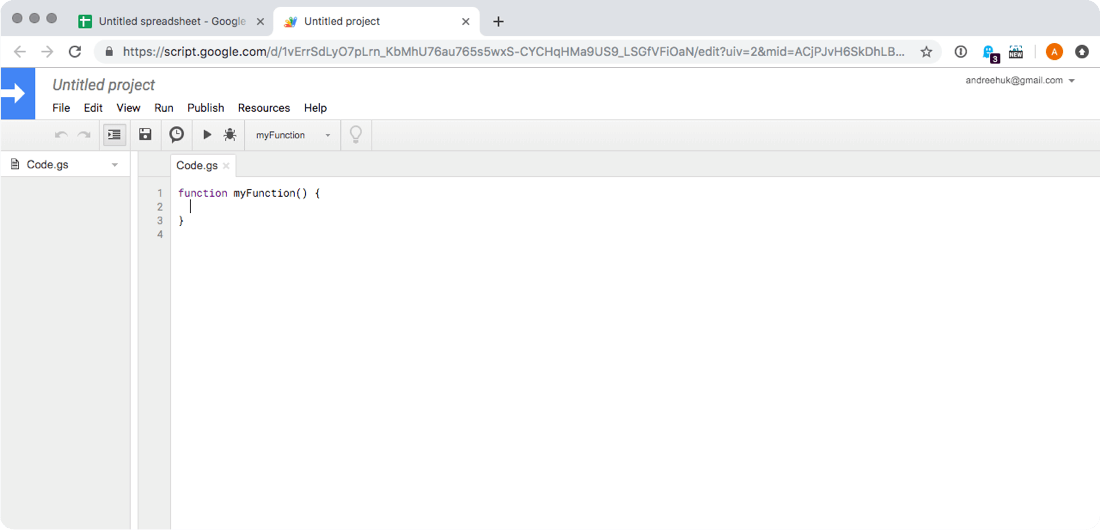
- Click on Tools -› Script Editor (this will open the App Script editor)
- Grab this JavaScript by hitting CMD/STRG-A, copy and paste the entire code into the App Script editor. Make sure to remove the default code (
function myFunction() {}) beforehand.
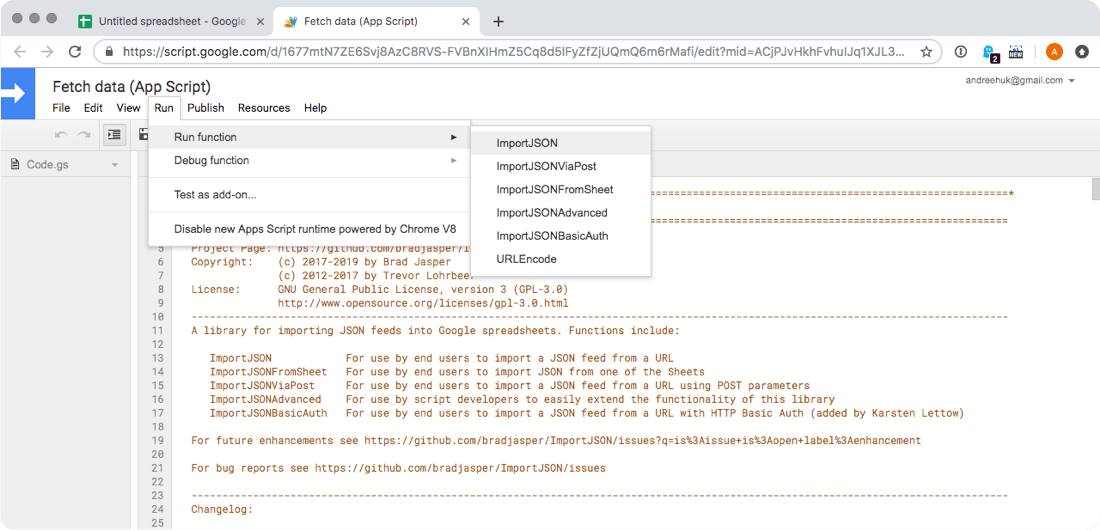
- Save script via CMD/STRG-S
- Important: Before doing anything else, run the main script
ImportJSONand follow the steps. You have to authorise the script before it can run. Review permissions, select a Google account. You have to deliberately select Advanced and then “Go to (name of file)” at the bottom, click Allow on the last screen. - When the script ran, you will see an error at the top similar to this: “Exception: Attribute provided with no value: url (line 220, file "Code”). Dismiss it, it doesn’t matter.
Step 4
This is the URL for the API that we will use: https://api.coingecko.com/api/v3/exchanges.
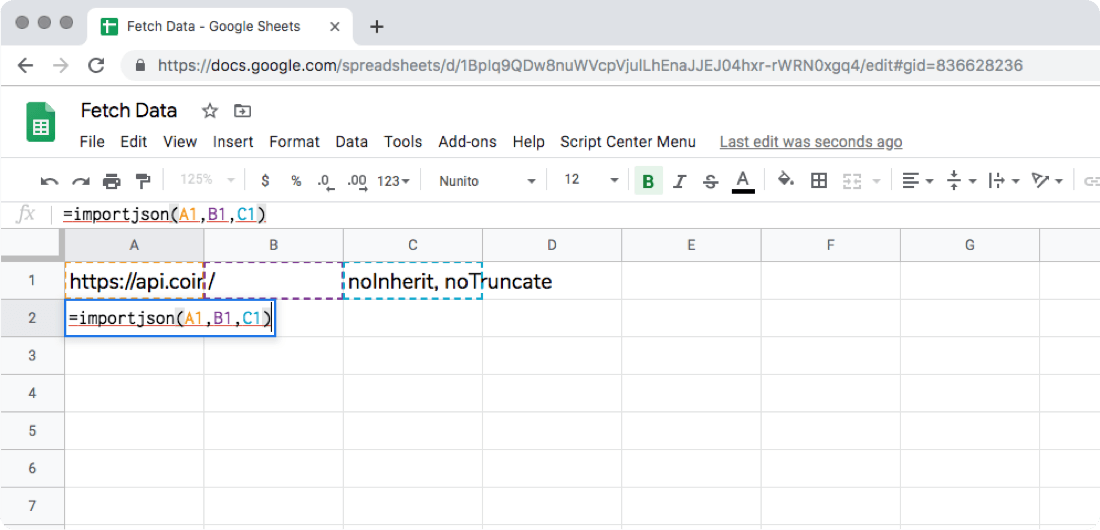
- In the spreadsheet in tab “Data”, copy and paste the URL into cell A1
- Into cell B1, paste
/. This basically tells the script to pull all data that the CoinGecko provides through the above URL. - Into cell C1, paste
noInherit, noTruncate - Enter
=importjson(A1,B1,C1)into cell A2 and hit enter - Wait. This will now pull the actual data from the API
- Tadaaaaaa! Now, you should see the data in the cells below, similar to the data in the image below
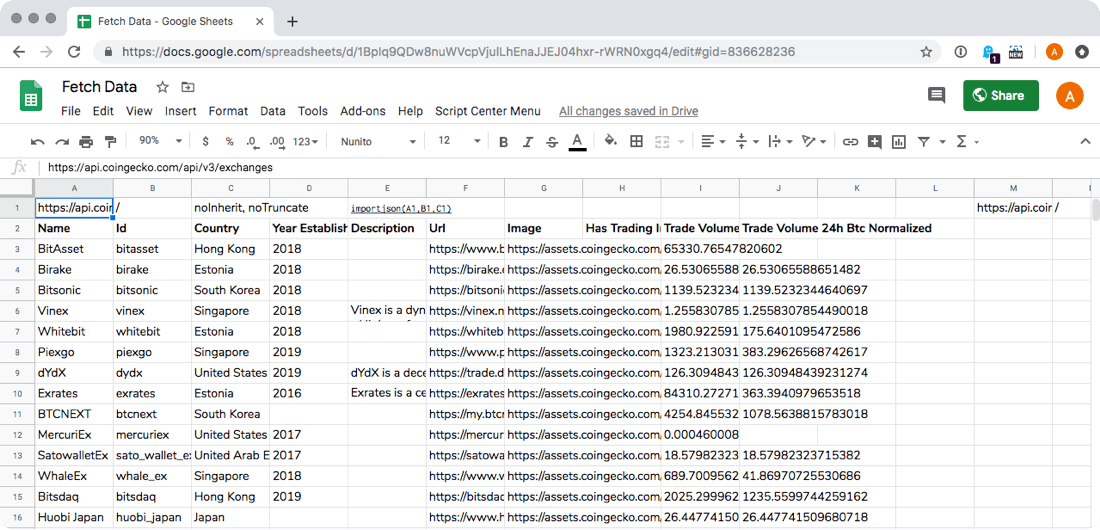
Now, that we have the data in the spreadsheet, let's pull it into XD.
The Google Sheets plugin in XD only takes data from the very first tab, the default one, that was created initially. We want to be selective about the data we pull into our XD file. Therefore, go to the tab “XD” and do the following:
- In cell A1, hit “=“ and then go to tab “Data” and select the cell B2 (B2 should show “Name”)
- Follow along by referencing the other fields in tab “Data” as we did according to our visual here (mind that here we have used a second spreadsheet, hence, the different spreadsheet name; the number values look different because we formatted them to only show 2 digits)
- Once you have A1, B1, C1 and D1 referenced, mark A1 to D1 and then click on the little blue square on the bottom right of the last cell D1 you have marked. Click and drag down in order to see the actual data points from tab “Data” in tab “XD”
Eventually, you should have a tab “XD” with about the same structure as you here:

A few important points:
- You will mostly likely have different data set in the cells on both tabs than the one you see on the visuals above (the API updates every hour/day or similar)
- If you have issues getting the cells in tab “XD” filled correctly, search on the web for “how to reference cells in Excel”.
Important: In cell A1 to D1 you must have the following or similar for the last step to work:
- A1 -› Name
- B1 -› Year Established
- C1 -› Country
- D1 -› Trade Volume 24h BTC
Which column has which data does not matter, as long as you match the cells correctly in the Google Sheets plugin during the very last step.
Step 5
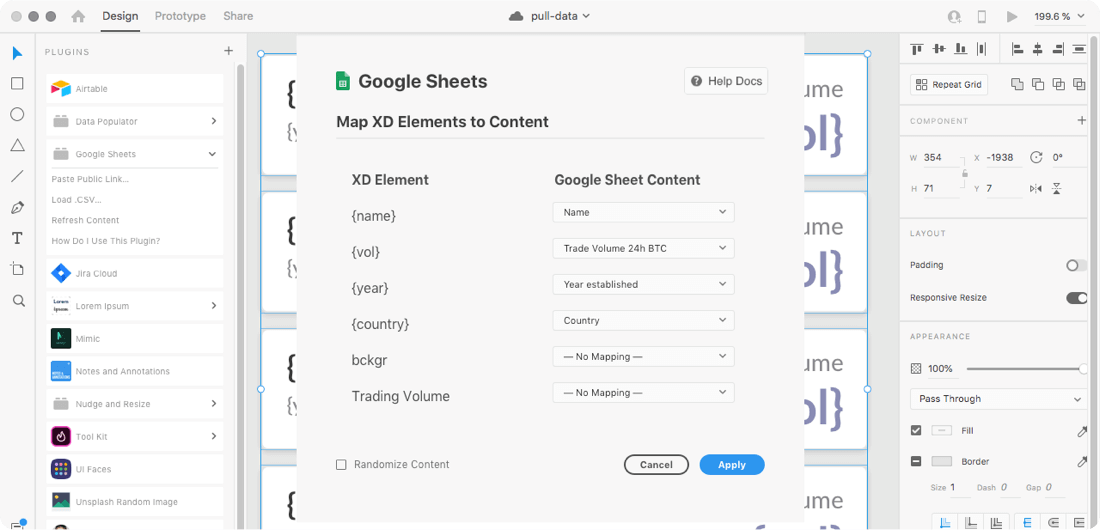
- Select the ungrouped grid in XD and go to the plugin section. FYI: Pulling data into XD only works with this plugin when elements are not components or repeater grids.
- Click on “Google Sheets” within the plugin list (plugin is only shown if you have installed the Google Sheets plugin)
- Click on “Paste Public Link…”
- Go to Google Sheets and click Share at the top right. Get a shareable link (or take ours)
- Go back to XD and paste the the Google Sheets link into the field that the plugin shows you and continue
- This last steps only works if you test this process with our file. We have renamed the text layers similar to the content of cells A1 to D1
- Click Apply (Google Sheets plugin in XD)
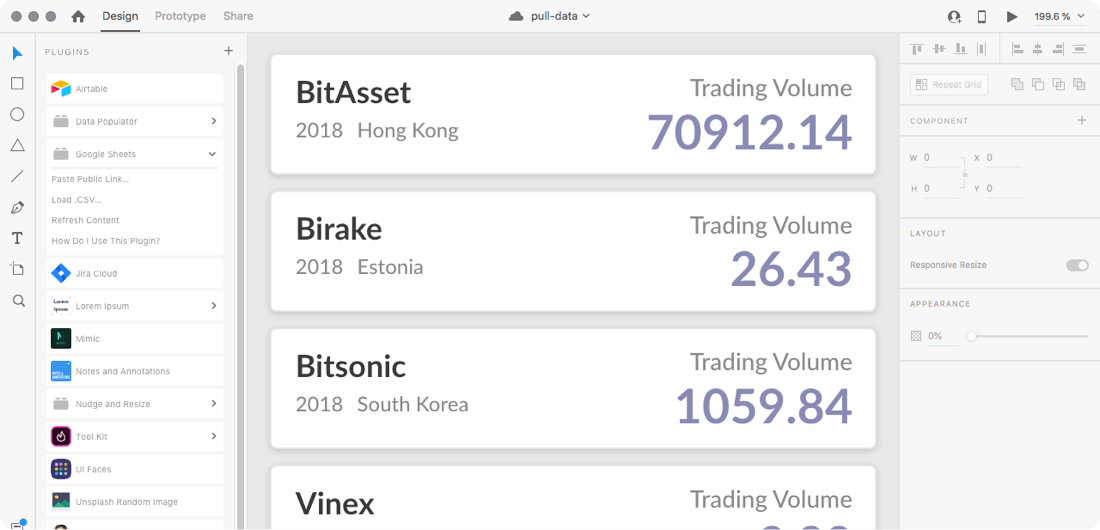
Tadaaaaa. The more elements in XD you have, the more data will be pulled in.
Potential issues you may face
- Make sure to run the script before trying to pull the data from the API. Pulling the data won’t work without it
- You don’t necessarily need two tabs. But then you need to make sure that the right data is shown in the right columns.
- If you are not sure how to get the right data from tab “Data” to tab “XD”, browse the web about how to reference cells. It works the same in Google Sheets as in Excel
- Google Sheets may show you an error when trying to pull data "Service invoked too many times." Unfortunately then, you will have to stop here and continue tommorrow.
Some issues remain with these plugins in XD (or Sketch for that matter):
- Many are not well designed, ie. simple to use
- Many don’t consider how a designer would actually uses XD or Sketch, for that matter. For example, if you typically build components in XD, the data import through this plugin shown here won't work.
- The plugins don’t stay up to date as the design tools do.
It comes down to the fact that developers need a stronger incentive to update plugins.
But what do designers need to work efficiently with live data
At the beginning, I showed this flow: Data from the web -› Google Spreadsheet -› Adobe XD. If we want to pull data from the web into our layouts, why do we have to go through Google Sheets? Well, for now, because that's for us the interface to structure the data. Although, the spreadsheet may help to work with content or marketing teams, the designers do not need the spreadsheet in between. In fact, the builders of Sketch and XD shall integrate live data capabilities into their design tools. We expect more convergence of code and design tools down the road.
If you happen to work with these builders at Sketch or XD, please reach out to us at @blended. We would be glad to help you understand the context in which we design and the way we use your design tools.
Thanks for reading.
Want to come up with a new digital product, expand your existing business, stay competitive? What's your next step?
Get in touch with Andree Huk
at +49 30 5557 7174 or [email protected].